Retirement Planning Advice and Financial Related Education by Barry Unterbrink, Chartered Retirement Planning Counselor

Thursday, June 09, 2022

Inflation Report Out Friday; Tune In

Friday's May inflation report could have massive implications for the markets. The report will be released at 8:30 a.m. by the Labor Department, and covered by most media. Here's the link to the Government site for all the juicy details: https://www.bls.gov/news.release/cpi.nr0.htm

The economists estimate of May inflation is an increase of +8.3% year over year, matching April's number. The more important data will be the month over month increase, expected to be up 0.6% from April. That will be more representative of current inflation trends. Since the last report, forecasters have hoped for a leveling out on inflation - that is; a decrease in month-over-month levels, showing that inflation has perhaps 'peaked'.

Stocks and bonds fell a lot on Thursday ahead of this report, giving back some of it's recent gains.

Oil and energy stocks, first highlighted here on March 8th posting, continued their rally as oil and gasoline prices continue to rise. The graph here shows gas prices since the summer of 2021 rising from $2.20 or so to the current $4.25 (excluding taxes).

With Crude Oil now at $120/barrell, energy stocks continue their gains. The two energy exchange traded funds (ETF's) FENY and XLE, have rallied 17% and 16.3% respectively since our March 8th post. The overall stock market, S&P 500, has lost 3.5% during that time.

I also recommended owning Gold as a hedge against higher inflation. That has NOT worked. Gold bullion prices and their ETF counterpart investments, lost about 10% since then: GLD, PHYS, SGOL. Higher interest rates hurt Gold's ownership since Gold does not pay any income or interest.

In March I stated, "I think adding or continuing to own a 10%-15% position in Gold and some oil stocks/ETF's may prove to continue adding value to your portfolio moving forward." I still feel this way.

Stock prices may continue to drift lower, but owning energy stocks will probably mitigate your overall portfolio losses. Even if Gold stays even from the $1,850 level, that will provide some ballast to your portfolio balance.

Energy and rent inflation account for 40% of the Consumer Price Index, and I can't see that declining much. Here's the graph on rents showing a 5.1% increase the past 12 months.


I don't know what Friday's inflation number will be, but a sub 8% year over year, or a 0.5% increase or less for May could provide a big rally in stock prices, and a rally in bonds and lower interest rates also. A "hot' number may prove the opposite. Tune in to see.

Thanks for reading.
Good night.


Sunday, April 10, 2022

Gold / Oil as an Inflation Hedge; One Month Update

My post from 4 weeks ago on the oil and Gold ideas has worked out pretty well at the one-month mark. See that post for below for the read if you missed it.

Generally, the oil ETF's recommended, FENY and XLE, gained 2.5% to 3.5%, while the individual stocks ran ahead more: Devon Energy, +6.6%, Halliburton, +8.6%, EOG Resources, +7.7%, and Conoco-Phillips was up 4.3%. The larger integrated oils, Exxon Mobile and Chevron fell about 1% each. Interestingly, the Crude Oil price fell during this period: from $119 to the current $102 or so. Oil traders must feel that the prospect of high prices (relative to expectations earlier), will hold up; so the stocks are bid up. 

My post on the run-up in Gold prices was the exact top of the market, at least short term. Gold fell in price from $2,060 to $1,910 near March's end; then a small rally to today's $1,945. Our exchange-traded funds (PHYS, GLD, SGOL) fell 3.8% to 5.3% in the period.

Let's not forget about the general market for stocks, as you would have owned some stocks outside of the oil stocks. The S&P 500 rallied 7.5% and the Dow Jones added 6.4%.

You can slice and dice the numbers anyway you see fit, but I think adding or continuing to own a 10%-15% position in Gold and some oil stocks/ETF's may prove to continue adding value to your portfolio moving forward.

Gas prices have settled back to the $3.95-$4.10 area, so that helps also on the consumer price side.

The March inflation report will be released Tuesday morning. I expect another 'hot' number above 7% year-over-year. We'll see.

Thanks for reading.

Tuesday, March 8th, 2022

Gold and Oil prices have rose sharply both this year and since the Russian invasion of Ukraine on February 24th.

Crude oil and gasoline prices rose well ahead of the war for varying reasons; the war just exacerbated the rise as supply challenges lie ahead if we cut off Russian supplied oil.

Gold has risen, in my opinion, due to the political uncertainty with both the war, and the high inflation - up 7.5% year over year - here in America. Gold is seen as a safe haven when a lot of assets are behaving poorly. Gold has proven to be a store of value for centuries. 

One way to look at investing is to own what is causing you the pain in your daily living. Gas prices are moving higher; own a few oil companies, or an index of oil and gas companies. Two I prefer are XLE and FENY. XLE is the Energy Select Sector Fund. It holds energy and exploration and drilling operators: Think Chevron, Exxon Mobil, Marathon Oil, Halliburton, Devon Energy. FENY is the Fidelity Investments version of XLE. It essentially owns the same stocks, as they both have similar weightings in the big oil companies.

Both are exchange traded - not mutual funds - so you can buy and sell them like stocks on the New York Stock Exchange. If you prefer individual stocks for some reason (taxes, dividends), you could buy the TOP 4 stocks in each investment, and you would own half the exchange traded fund: Exxon Mobil (XOM), Conono-Phillips (COP), Chevron (CVX) and EOG Resources (EOG). Since the wars start, XLE is up 14%, while FENY gained 15%.

Gold sputtered last year, losing 4% in the bullion price, after two good years of +18% and +23% in 2019 and 2020. Stocks were the place to be then. This year, Gold has gained investors confidence again. 
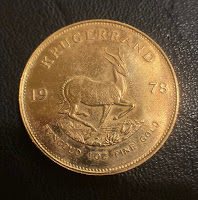
Gold Kruggerand 1 Ounce
It's not always fun seeing Gold prices 'sit' while bonds and stocks go up. We advocate holding 10% - 15% in Gold as an insurance policy against - well - wars and inflation. Gold trades today at $2,060 per ounce. It's up $135/ounce in 13 days since Vlad's invasion! It's knocking on the door of the all-time high of $2,071 during 2020. Bullion is harder to own and of course store. We again prefer the exchange funds: simply, SPDR Gold (GLD) stores its gold in London, SGOL has Switzerland Vaults, and PHYS is the Canadian Mints 'lock box' for that Gold exchange traded fund. Don't buy Gold mining stocks; they may not track Gold's price accurately. If you buy the bullion, stick with recognizable one ounce 'rounds' like the Kruggerand, pictured above, or the Canadian Maple Leaf. Gold bars and smaller denomination coins are marked up more. Expect a 4-5% mark up or mark down with the one ounce coin buys and sales.

So, as a diversified investor, let's recap the past couple of weeks with Stocks, Bonds, Oil and Gold. (Feb. 23rd thru March 8th).

        S&P 500 Index (stocks) ...........  down 1.3%
        Bonds (Long Term Treasury)..... up 1%
        Oil and Gas Exchange Funds .... up 14%
        Gold bullion / exchange Fund ... up  8%

Will Gold and Oil hold onto their gains made the past month? We'll see. If Gold and Oil do retreat, we look for stocks to move higher, or Bonds to stablize. There are a lot of scenarios that COULD play out favorable for Gold and Oil.

The gas pump price above was what I paid Monday for the premium gas. It costs me $0.20 a mile to move my SUV down the road at that price. So if I can make a little money from my Gold and Oil stocks, maybe I can feel (a bit) better at the pump next week ! Time will tell.

Thanks for reading!
Share as you so desire!

~Barry

P.S. If you type "GOLD" in the search box for this blog, you can view and read my other posts on Gold dating back a few years.


Monday, March 28, 2022

Just How Bad is Current Inflation?

 Biden's Inflation Surpasses Trump's 4 Year Total in Just 13 Months!

That's a pretty bold headline that wouldn't seem true to the fact checkers, but it is true, according to our Government's reports.

I dug into the 'hot topic' inflation data put out by our Government each month, and - drum roll please - the current administration's Consumer Inflation is now up +8.46% since inauguration day, 2021! The Trump tenure saw inflation rise also, with a TOTAL gain in prices at +7.72%. That's 7.72% inflation over 4 years. Biden & Co. has seen 13 inflation reports; Feb., 2021 through Feb., 2022 thus far. Here's the Bureau of Labor Statistics snippet from their web site: https://tinyurl.com/2p8h7vyw

                                         Jan      Feb      Mar

They use an index, so it's easy to compare percentage changes across the time frames you want. Their data goes back to 1913. The yellow highlights the Trump presidency, 2017 to 2021. The red line is last month's inflation index of 283.716; that's up 8.46% over the inauguration month end (Jan/'21) index of 261.582.

It's probably not fair to blame the current White House for all the inflation. There are always factors that one staff inherits from the last. COVID-19 hurt the last year of Trump's reign, which I feel kept inflation low (+1.4%). An accomodative Federal Reserve kept interest rates low for years now, while spurring housing and asset (stocks) inflation demand to name a few. The Russian invasion has exacerbated the problem of inflation as energy prices surged the last month.

And certainly this report is just one year of data. The Federal Reserve has two mandates: to seek full employment, and to manage inflation. Their 2% target inflation will be hard to achieve with such a big hole to climb out of for the current Biden administration.

So how have past President's fared with inflation: Going back to Richard Nixon, in 1973 and forward, here are the results:
                                                   
    President                   Term                    Total Inflation
Richard Nixon/Gerry Ford1973 - 1977*             +64.3%
Jimmy Carter, Democrat   1977 - 1981               +48.7%
Ronald Reagan, Repub.     1981 - 1985               +21.3%
Ronald Reagan, Repub.     1985 - 1989               +14.8%
George Bush #41, Repub   1989 - 1993               +17.8%
Bill Clinton, Democrat       1993 - 1997               +11.6%
Bill Clinton, Democrat       1997 - 2001               +10.0%
George Bush #43, Repub    2001- 2005                +8.9%
George Bush #43, Repub    2005 - 2009               +10.7%
Barak O'Bama, Democrat   2009 - 2013               +9.1%
Barak O'Bama, Democrat   2013 - 2017                +5.5%
Donald Trump,
Repub.       2017 - 2021                +7.8%
Joe Biden, Democrat           2021 - ?                      +8.46%

That's 13 elections and 10 Presidents; 6 Republican and 4 Democrats. You can see that both Nixon and Carter both had major inflation with oil prices high. It generally fell during the 1980's, reaching single digits in 2005. O'bama's second term was the best, at just +5.5%. That's history. Draw your own conclusions with my numbers presented.

Maybe it'll be useful for cocktail conversations also; just keep it respectful and civil folks.
Thanks for reading!
* I combined the Nixon/Ford presidencies as Nixon resigned in Aug/74 and Ford served out the remaining term. Nixon's was +38.8% inflation, Ford's +18.4%. Both were Republican's.