Retirement Planning Advice and Financial Related Education by Barry Unterbrink, Chartered Retirement Planning Counselor

Tuesday, March 17, 2020

2020 Bear Market Extends Coronavirus Losses

The stock market's near 3,000 point loss in Monday's trading now places it in the 6th position in the list of the worst bear markets since 1946!

Here's the table. I have highlighted it in RED in care your tired eyes have trouble reading it. Mine do.

Dates (date range) Percent Loss # Months
2007-2009 -54 17
1973-1974 -45 23
2000-2002 -38 33
1969-1970 -36 18
1987 -36 3
2020 - ? -31.9 1
1961-1962 -27 7
1976 -27 17
1966 -25 8
1946-1948 -24 36
1981-1982 -24 15
1956 -19 19
1978-1979 -16 20

While many stocks are down more than 30%, a few are not as badly damaged; very few. None-the-less, remember the Math. A 30% decline in a stock will take a 43% gain to get back to even. 100 / (100-30).


That may be a tall order, or one that will take months of patience to pull off. I can only hope that you are diversified with some bonds, cash and Gold to partially offset the stock prices falling.


Continuing from last week's post, the stock market's been on an 11 year run, averaging +14.7% compound growth each year. If the historical long term market gain is closer to 10% per year, then consider this.

The Dow Jones could sit here at Dow 20,000 for one full year, and not move - and then you would have your +10% growth rate over the past 12 years! The move from 20,000 to near 30,000 was "gravy" so to speak. In finance, it's called 'reversion to the mean'.


Recall the last sharp BULL run in stocks; 2003-2007, almost a doubler, or +14% each year. We know what 2008-2009 gave us after the bull died (see table). Or how about 1995-1999, another 5 years, with a +26% per year barn-burner.

Then, only to see 37% lopped off prices in the 2000-2002 bear market. If you look then at the bull/bear market 8 year gains, 1995-2002, your back down to a +9.4% average gain. See the pattern here?


So any good news from this predicament? Well, sort of. When bear markets run their course, the ensuing year(s) are usually outstanding - due to pent up demand and better increasing confidence in the economy and earning prospects.

When could that happen? No human knows for sure, but when total despair and surrendar are being displayed - when all sense of purpose as an investor are erased; when there's "blood in the streets", quoted Baron Rothschild, an 18th-century British nobleman and member of the Rothschild banking family. "Buy when there's blood in the streets, even if the blood is your own."

Stay tuned.


Wednesday, March 11, 2020

Dow Jones Industrials Enter Bear Market Today

The popular Dow Jones Industrial Average officially entered a Bear Market as of 4:00 PM today, Wednesday, March 11th.


It took just 19 trading days to accomplish this - dating back to just mid-February when it closed at an all-time high of 29,551.42.

I reported in the March 10th blog post of the significance of Bear Markets, and how you can prepare for them with some risk reducing strategies with your money,

 
The Dow Industrials are now down 20.3%, or 5,998 points from the peak last month, February 12th to be exact!

The widely followed Standard & Poor's 500 Index, used moreso by professional investors and institutions, escaped bear market status by a thin margin Wednesday. It's down 18.9%, and would need to fall about 38 points to enter it's own -20% bear market.

Stay tuned for more news as it develops.


Tuesday, March 10, 2020

Is This a Bear Market? How to Plan for One

The stock market performance over the past several weeks has been atrocious.

Has the 11 year bull market in stock prices come to an end? It sure seems so, by the flowing of plentiful red down arrows on my computer screens. Including Monday's 2,013 point loss on the Dow Jones Industrial's Average, we have fallen 5,700 points or a whopping -19.3%, before a nice +4.9% gain today. It took just 17 trading days to get a near 20% decline.


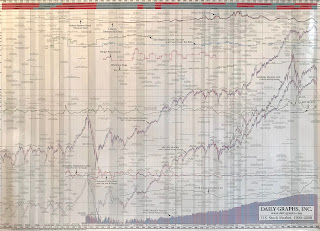
Wall Street uses terms such as 'correction' and bear market, so let's understand them. A correction is a move down of 10%, while a bear market occurs when a move down is 20%. So we're right on the cusp of a bear market, down 19.3% to be precise on Monday's close. I dispay a wall chart of the stock market and economic data starting in 1900. An interesting read for history buffs.


Bear markets occur about every 7 years on average; that's in the Post World War 2 era covering about 75 years. So there have been 10 bear markets, shown here by this table I've constructed. I've included a few corrections also if they were close to the -20%.


Dates (date range) Percent Loss # Months
1946-1948 -24 36
1956 -19 19
1960-1962 -27 7
1966 -25 8
1968-1969 -35 18
1973-1974 -45 23
1976 -27 17
1978 -16 20
1980-1981 -24 15
1987 -36 3
2000-2002 -38 33
2007-2009 -50 17
2020 - ? -19 1 month


As you can view, the time frame of bear markets is all over the map. Quick bears were in '60, '66 and 1987. Longer term, more worrisome bear markets ocurred in '46, '73-'74, 2000-2002. My father started managing pension fund money in early 1973 and surely can attest to the pain of that bear market.

The current bear market is an infant toddler, at just under one month now using the Feb. 12th Dow Jones high close.

Here's the concerns and opportunities.
First, your portfolio is rarely all stock-based, so your "personal" bear market may look very different than the table above. Owning bonds and cash - even Gold - would normally reduce your overall losses in a stock market decline.


Also, don't fret over small losses. Very few investors sell at the top. And when you sell, you immediately have another decision down the road; where to invest next, or when to get back in. It's your mix of stocks and bonds that will determine most risks in investing. So let's use the word "exchange" rather than sell when moving money around. Don't you feel better already?


Try this exercise: Track your performance of all your accounts for a day, or a week, PREFERABLY when stocks move up and down a lot, like now. Then track the Dow Jones Industrials against that for the same time-span.

If your accounts lost 3% yesterday, when the Dow lost 7%, then your "BETA" is 0.42. Three divided by 7. That is, your money lost 42% of an all-invested basket of stocks (the Dow Jones 30 stocks). 


It's a bit technical, but optimally, you want a lower beta in a bear market in stocks, and a higher beta in bull markets. A beta of 1.00 would show you move in lockstep with the Dow. A beta of 1.30 shows you are agressive and will get a 30% gain over the Dow Jones. A negative beta of -1.00 would show your portfolio goes up dollar for dollar when stocks go down. Gold and precious metals vs. stocks, for instance are noted for their negative beta. 


Your IRA may be in mutual funds and some Gold funds, what's your BETA? Your brokerage account contains more speculative stocks; what's that BETA? That one number will tell a lot about how you are invested risk-wise.

Generally, younger investors should have higher betas that older investors. If you're nearing retirement, your beta should normally be no more than 0.50. Why?

It takes longer to recover your money in stocks if your losses are greater at the end of the bear market. A 20% loss takes a 25% gain to get even, a 30% loss takes 43% to get back to even. If your beta is lower, you'll generally lose less in the bear stock market, and can recover your money faster in the ensuing bull market.

That could be uber-important if you have cash needs during that time, or are planning to retire not knowing when the bear market will end. The 2007-2009 bear market took 17 months to play out.


Could you postpone spending or delay your planned retirement by 3+ years if most of your money was in the stock market? The 2007-2009 bear market didn't get back to even on the Dow Jones until the Spring of 2011, a full 40 months later!

If I were to ask you what your risk reduction strategy is, how would you answer? Think about it. Some valid answers would be: lowering your portfolios beta, setting stops to sell to avoid large losses; buying an annuity or short term bonds with less risk than stocks? Adding Gold to your holdings. Ask your advisor what his plan is for you. 

 
Hope this sheds some light on how to improve your portfolio management, and how risks are handled in our modern investing era. Call or e-mail with questions or comments.


Thanks for reading!